 OrbFlow Labs
Levels Suite
The price levels intraday futures traders watch, in one overlay: session, previous-day, weekly and monthly levels, the previous session's volume profile, unmitigated swing levels and open gaps. Levels clear themselves when price trades through them, and labels that sit close together stack instead of overlapping. It gives no buy or sell signals.
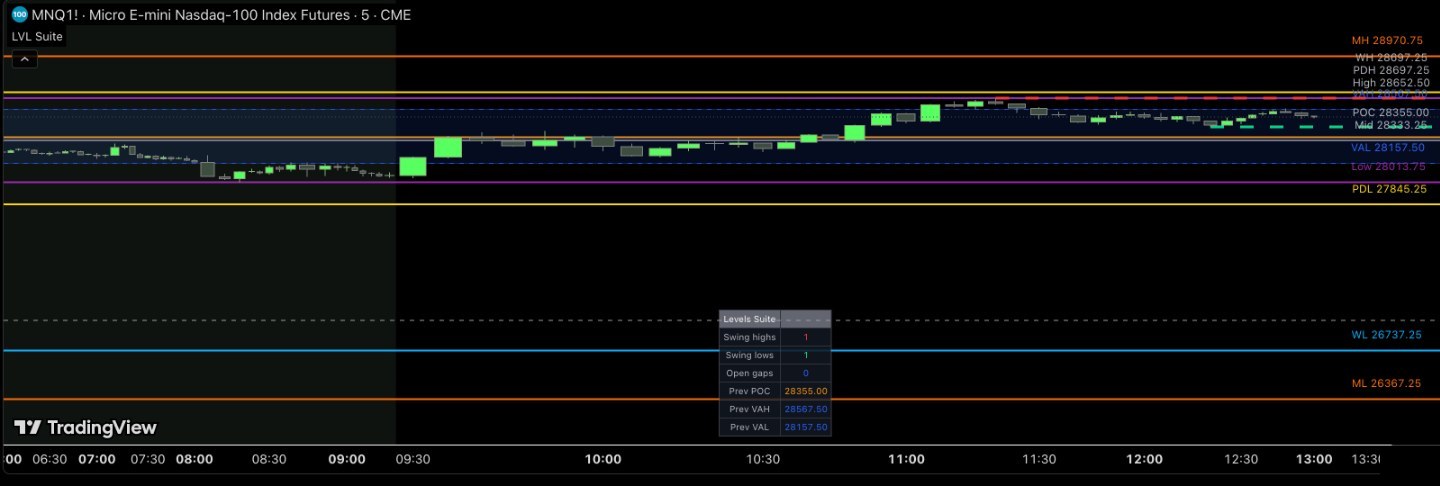
MNQ1! 5-minute, 12 Nov 2026. Chart shows where price has been; it doesn't predict where it will go.
Only the levels still in play
Session levels
Today's high, low and midpoint, the previous day's high and low, and this week's and month's high and low. The day rolls at the CME Globex open (adjustable).
Volume profile
The previous session's point of control, value-area high and low, and an optional histogram, all from one profile engine so they always agree.
Swing levels
Confirmed swing highs and lows drawn from the true wick, removed as soon as price trades through. Only unmitigated levels stay.
Open gaps
Bars that open beyond the previous bar's range, kept on the chart until price fills them.
Every level gets a price tag above its line. Tags that would print on top of each other merge into one stacked tag, spaced to your chart's price scale. A small panel counts active swing levels and gaps and shows the previous POC, VAH and VAL.
Limitations
- The volume profile is approximated from bar volume, not built from tick data, so the POC and value area can differ slightly from an exchange-data profile. It's more accurate on lower timeframes.
- Swing levels are confirmed late. A pivot is drawn a set number of bars after the swing, and never moves once drawn.
- Defaults suit CME futures. Markets with a different trading day need the session open adjusted.
- Price tags need right margin on the chart (about 20–25 bars) to be fully visible.
- It's a charting tool, not a strategy. Nothing it shows predicts future prices.